Data Behind Data Science
- 10 minsData source:
the dataset for this analysis was downloaded from CrowdFlower
Decsription
A look into what skills data scientists need and what programs they use. A part of our 2015 data scientist report which you can download.
import pandas as pd
from wordcloud import WordCloud
data = pd.read_csv('DS-skills-DFE.csv')
lets view the dataset
data.head()
| post_yn | cloud_software_required | database_software_required | statistic_software_required | programming_language_required | linkedin_url | |
|---|---|---|---|---|---|---|
| 0 | yes | Hive | SQL | R | Python | https://www.linkedin.com/jobs2/view/26909460?t... |
| 1 | yes | NaN | SQL | NaN | Python | https://www.linkedin.com/jobs2/view/18721409?t... |
| 2 | yes | NoSQL | SQL | NaN | Python | https://www.linkedin.com/jobs2/view/13715592?t... |
| 3 | yes | NoSQL | SQL | SPSS | Python | https://www.linkedin.com/jobs2/view/13529837?t... |
| 4 | yes | Pig | NaN | R | Python | https://www.linkedin.com/jobs2/view/38267683?t... |
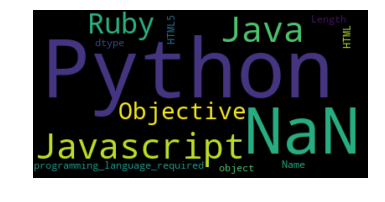
lets check the popularity of language use in data science
data.programming_language_required.value_counts()
Python                  367
Java/Javascript          73
Ruby                     55
C/C++/C#/Objective-C     22
HTML/HTML5                7
Perl                      2
Name: programming_language_required, dtype: int64
text = data.programming_language_required
text = str(text)
wordcloud = WordCloud().generate(text)
# Display the generated image:
# the matplotlib way:
import matplotlib.pyplot as plt
%matplotlib inline
plt.imshow(wordcloud, interpolation='bilinear')
plt.axis("off")
(-0.5, 399.5, 199.5, -0.5)
pl = data.programming_language_required.value_counts()
ax = pl.plot(kind='bar',figsize=(18,8))
ax.set_alpha(1)
plt.title("Popularity of language in Data science 2015", fontname='Ubuntu', fontsize=18,
            fontstyle='italic', fontweight='bold',color='green')
plt.rc('xtick',labelsize=23)
plt.rc('ytick',labelsize=23)
# create a list to collect the plt.patches data
totals = []

# find the values and append to list
for i in ax.patches:
    totals.append(i.get_height())

# set individual bar lables using above list
total = sum(totals)

# set individual bar lables using above list
for i in ax.patches:
    # get_x pulls left or right; get_height pushes up or down
    ax.text(i.get_x()-.03, i.get_height()+.5, \
            str(round((i.get_height()/total)*100, 2))+'%', fontsize=15,
                color='black')
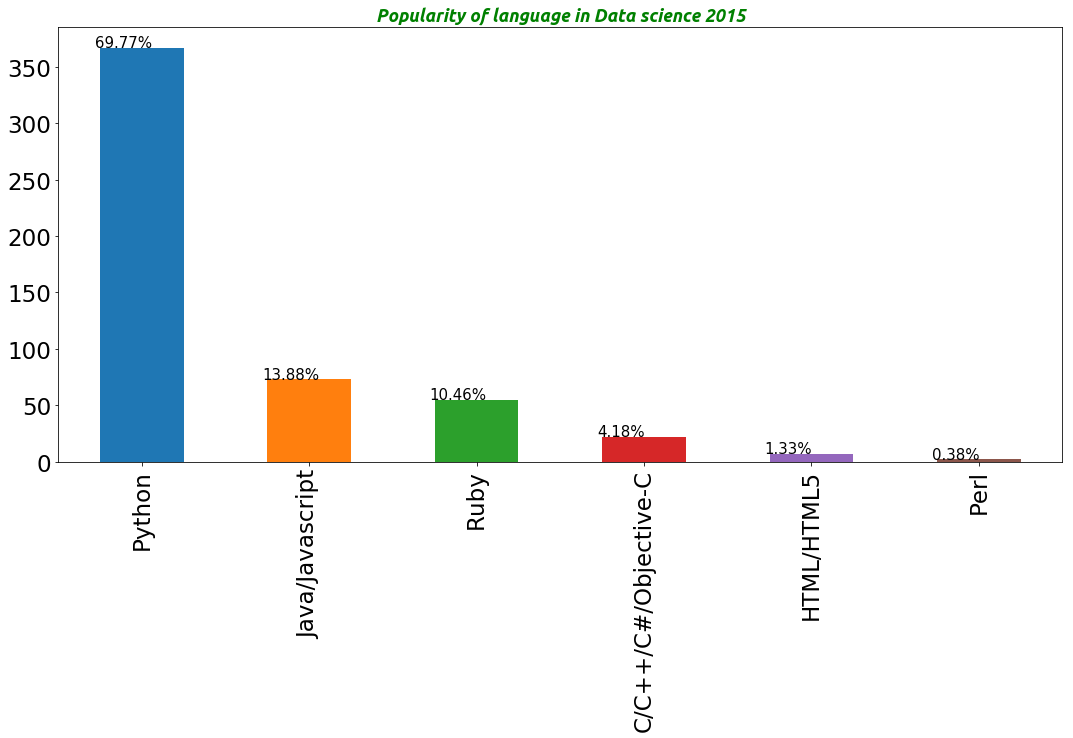
as we can from the report python overshadowed the rest by a massive marging..it is interesting to observe that R which is massively popular in Data science is not consider as a programming language according to the report
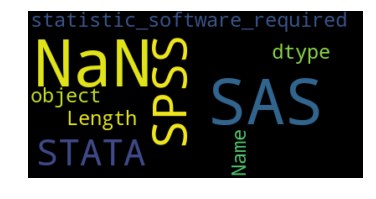
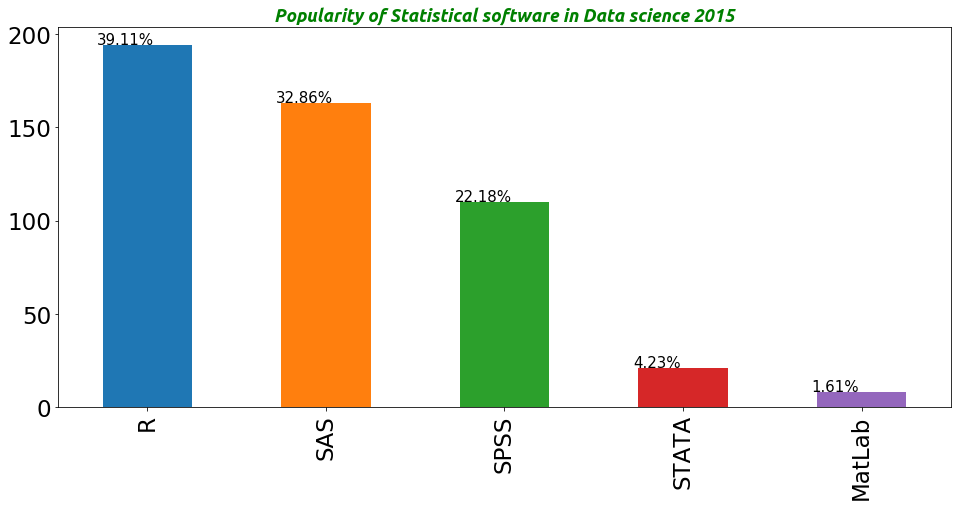
lets check the popularity of statistic software
data.programming_language_required.value_counts()
data.statistic_software_required.value_counts()
R         194
SAS       163
SPSS      110
STATA      21
MatLab      8
Name: statistic_software_required, dtype: int64
text_s = data.statistic_software_required
text_s = str(text_s)
wordcloud = WordCloud().generate(text_s)
plt.imshow(wordcloud, interpolation='bilinear')
plt.axis("off")
(-0.5, 399.5, 199.5, -0.5)
pl_s = data.statistic_software_required.value_counts()
ax = pl_s.plot(kind='bar',figsize=(16,7))
plt.title("Popularity of Statistical software in Data science 2015", fontname='Ubuntu', fontsize=18,
            fontstyle='italic', fontweight='bold',color='green')
plt.rc('xtick',labelsize=23)
plt.rc('ytick',labelsize=23)
# create a list to collect the plt.patches data
totals = []

# find the values and append to list
for i in ax.patches:
    totals.append(i.get_height())

# set individual bar lables using above list
total = sum(totals)

# set individual bar lables using above list
for i in ax.patches:
    # get_x pulls left or right; get_height pushes up or down
    ax.text(i.get_x()-.03, i.get_height()+.5, \
            str(round((i.get_height()/total)*100, 2))+'%', fontsize=15,
                color='black')
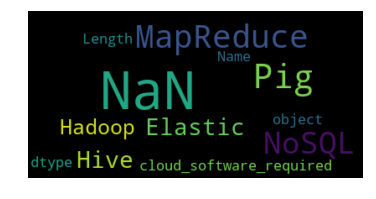
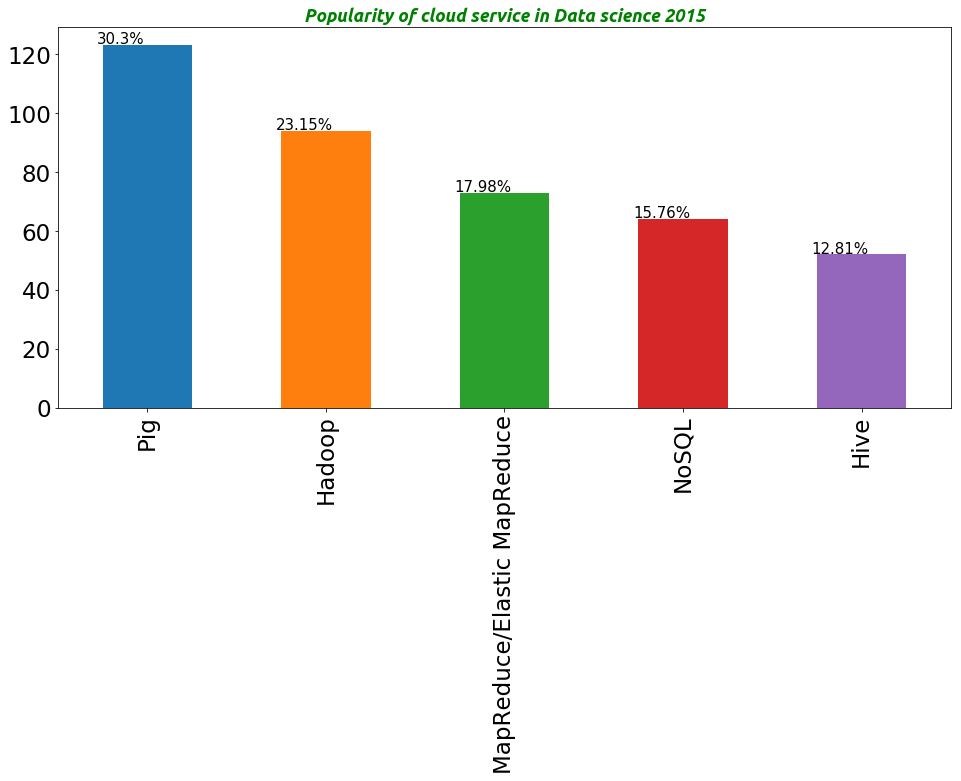
lets insepct the popularity of cloud service in data science
data.cloud_software_required.value_counts()
Pig                            123
Hadoop                          94
MapReduce/Elastic MapReduce     73
NoSQL                           64
Hive                            52
Name: cloud_software_required, dtype: int64
text_c = data.cloud_software_required
text_c = str(text_c)
wordcloud = WordCloud().generate(text_c)
plt.imshow(wordcloud, interpolation='bilinear')
plt.axis("off")
(-0.5, 399.5, 199.5, -0.5)
pl_c = data.cloud_software_required.value_counts()
ax = pl_c.plot(kind='bar',figsize=(16,7))
plt.title("Popularity of cloud service in Data science 2015", fontname='Ubuntu', fontsize=18,
            fontstyle='italic', fontweight='bold',color='green')
plt.rc('xtick',labelsize=23)
plt.rc('ytick',labelsize=23)
# create a list to collect the plt.patches data
totals = []

# find the values and append to list
for i in ax.patches:
    totals.append(i.get_height())

# set individual bar lables using above list
total = sum(totals)

# set individual bar lables using above list
for i in ax.patches:
    # get_x pulls left or right; get_height pushes up or down
    ax.text(i.get_x()-.03, i.get_height()+.5, \
            str(round((i.get_height()/total)*100, 2))+'%', fontsize=15,
                color='black')
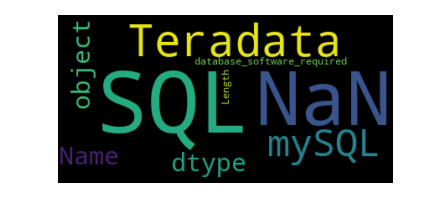
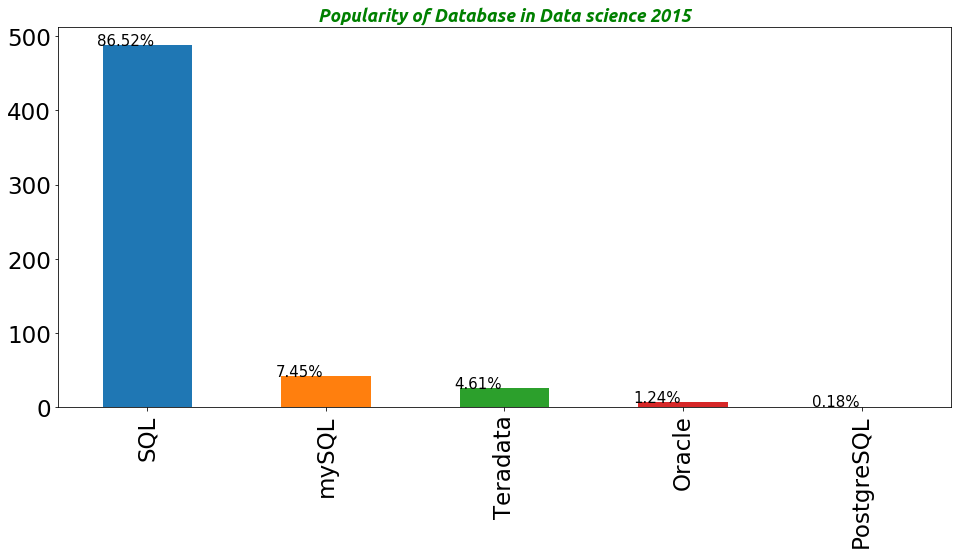
data.database_software_required.value_counts()
SQL           488
mySQL          42
Teradata       26
Oracle          7
PostgreSQL      1
Name: database_software_required, dtype: int64
text_d = data.database_software_required
text_d = str(text_d)
wordcloud = WordCloud().generate(text_d)
plt.imshow(wordcloud, interpolation='bilinear')
plt.axis("off")
(-0.5, 399.5, 199.5, -0.5)
pl_d = data.database_software_required.value_counts()
ax = pl_d.plot(kind='bar',figsize=(16,7))
plt.title("Popularity of Database in Data science 2015", fontname='Ubuntu', fontsize=18,
            fontstyle='italic', fontweight='bold',color='green')
plt.rc('xtick',labelsize=23)
plt.rc('ytick',labelsize=23)
# create a list to collect the plt.patches data
totals = []

# find the values and append to list
for i in ax.patches:
    totals.append(i.get_height())

# set individual bar lables using above list
total = sum(totals)

# set individual bar lables using above list
for i in ax.patches:
    # get_x pulls left or right; get_height pushes up or down
    ax.text(i.get_x()-.03, i.get_height()+.5, \
            str(round((i.get_height()/total)*100, 2))+'%', fontsize=15,
                color='black')
Summary
According to this Data source the most sought after Programming language in data science is Python while the most sought after statistical Software is R.In terms of cloud service Pig is the most popular while SQL is the goto database in data science

Mustapha Omotosho
constant learner,machine learning enthusiast,huge Barcelona fan