Noble Prize Winners
- 14 minsfrom IPython.core.display import HTML, Image
Image('obama.jpg')

import pandas as pd
HTML("<h4>we import the dataset which is in csv format</h4>")
we import the dataset which is in csv format
data_set = pd.read_csv('archive.csv')
HTML("<h4>lets check the length of the dataset</h4>")
lets check the length of the dataset
len(data_set)
969
HTML("<h4>display the first five rows</h4>")
display the first five rows
data_set.head()
| Year | Category | Prize | Motivation | Prize Share | Laureate ID | Laureate Type | Full Name | Birth Date | Birth City | Birth Country | Sex | Organization Name | Organization City | Organization Country | Death Date | Death City | Death Country | |
|---|---|---|---|---|---|---|---|---|---|---|---|---|---|---|---|---|---|---|
| 0 | 1901 | Chemistry | The Nobel Prize in Chemistry 1901 | "in recognition of the extraordinary services ... | 1/1 | 160 | Individual | Jacobus Henricus van 't Hoff | 1852-08-30 | Rotterdam | Netherlands | Male | Berlin University | Berlin | Germany | 1911-03-01 | Berlin | Germany |
| 1 | 1901 | Literature | The Nobel Prize in Literature 1901 | "in special recognition of his poetic composit... | 1/1 | 569 | Individual | Sully Prudhomme | 1839-03-16 | Paris | France | Male | NaN | NaN | NaN | 1907-09-07 | Châtenay | France |
| 2 | 1901 | Medicine | The Nobel Prize in Physiology or Medicine 1901 | "for his work on serum therapy, especially its... | 1/1 | 293 | Individual | Emil Adolf von Behring | 1854-03-15 | Hansdorf (Lawice) | Prussia (Poland) | Male | Marburg University | Marburg | Germany | 1917-03-31 | Marburg | Germany |
| 3 | 1901 | Peace | The Nobel Peace Prize 1901 | NaN | 1/2 | 462 | Individual | Jean Henry Dunant | 1828-05-08 | Geneva | Switzerland | Male | NaN | NaN | NaN | 1910-10-30 | Heiden | Switzerland |
| 4 | 1901 | Peace | The Nobel Peace Prize 1901 | NaN | 1/2 | 463 | Individual | Frédéric Passy | 1822-05-20 | Paris | France | Male | NaN | NaN | NaN | 1912-06-12 | Paris | France |
HTML("<h4>display the last five rows</h4>")
display the last five rows
data_set.tail(5)
| Year | Category | Prize | Motivation | Prize Share | Laureate ID | Laureate Type | Full Name | Birth Date | Birth City | Birth Country | Sex | Organization Name | Organization City | Organization Country | Death Date | Death City | Death Country | |
|---|---|---|---|---|---|---|---|---|---|---|---|---|---|---|---|---|---|---|
| 964 | 2016 | Medicine | The Nobel Prize in Physiology or Medicine 2016 | "for his discoveries of mechanisms for autophagy" | 1/1 | 927 | Individual | Yoshinori Ohsumi | 1945-02-09 | Fukuoka | Japan | Male | Tokyo Institute of Technology | Tokyo | Japan | NaN | NaN | NaN |
| 965 | 2016 | Peace | The Nobel Peace Prize 2016 | "for his resolute efforts to bring the country... | 1/1 | 934 | Individual | Juan Manuel Santos | 1951-08-10 | Bogotá | Colombia | Male | NaN | NaN | NaN | NaN | NaN | NaN |
| 966 | 2016 | Physics | The Nobel Prize in Physics 2016 | "for theoretical discoveries of topological ph... | 1/2 | 928 | Individual | David J. Thouless | 1934-09-21 | Bearsden | United Kingdom | Male | University of Washington | Seattle, WA | United States of America | NaN | NaN | NaN |
| 967 | 2016 | Physics | The Nobel Prize in Physics 2016 | "for theoretical discoveries of topological ph... | 1/4 | 929 | Individual | F. Duncan M. Haldane | 1951-09-14 | London | United Kingdom | Male | Princeton University | Princeton, NJ | United States of America | NaN | NaN | NaN |
| 968 | 2016 | Physics | The Nobel Prize in Physics 2016 | "for theoretical discoveries of topological ph... | 1/4 | 930 | Individual | J. Michael Kosterlitz | 1943-06-22 | Aberdeen | United Kingdom | Male | Brown University | Providence, RI | United States of America | NaN | NaN | NaN |
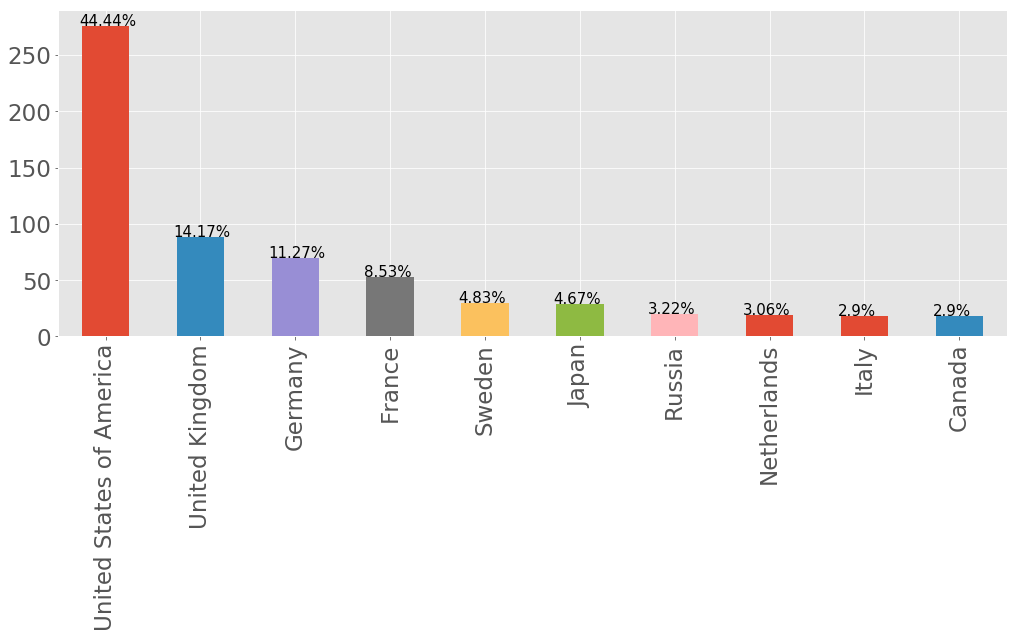
HTML("<h4> 10 Countries with the most awards</h4>")
10 Countries with the most awards
data_set['Birth Country'].value_counts().head(10)
United States of America    276
United Kingdom               88
Germany                      70
France                       53
Sweden                       30
Japan                        29
Russia                       20
Netherlands                  19
Italy                        18
Canada                       18
Name: Birth Country, dtype: int64
top10 = data_set['Birth Country'].value_counts().head(10)
HTML("<h4> 10 Countries with the least awards</h4>")
10 Countries with the least awards
data_set['Birth Country'].value_counts().tail(10)
Poland (Lithuania)                          1
British West Indies (Saint Lucia)           1
Venezuela                                   1
Free City of Danzig (Poland)                1
Austria-Hungary (Bosnia and Herzegovina)    1
Austrian Empire (Italy)                     1
Bavaria (Germany)                           1
Ottoman Empire (Turkey)                     1
Württemberg (Germany)                  1
Gold Coast (Ghana)                          1
Name: Birth Country, dtype: int64
HTML("<h4>lets visualize top ten countries with the most awards</h4>")
lets visualize top ten countries with the most awards
import matplotlib.pyplot as plt
%matplotlib inline
plt.style.use('ggplot')
def adjust_plot(ax):
    plt.rc('xtick',labelsize=23)
    plt.rc('ytick',labelsize=23)
    # create a list to collect the plt.patches data
    totals = []
    # find the values and append to list
    for i in ax.patches:
        totals.append(i.get_height())

    # set individual bar lables using above list
    total = sum(totals)

    # set individual bar lables using above list
    for i in ax.patches:
        # get_x pulls left or right; get_height pushes up or down
        ax.text(i.get_x()-.03, i.get_height()+.5, \
            str(round((i.get_height()/total)*100, 2))+'%', fontsize=15,
                color='black')
ax= top10.plot.bar(figsize=(17,6))
adjust_plot(ax)
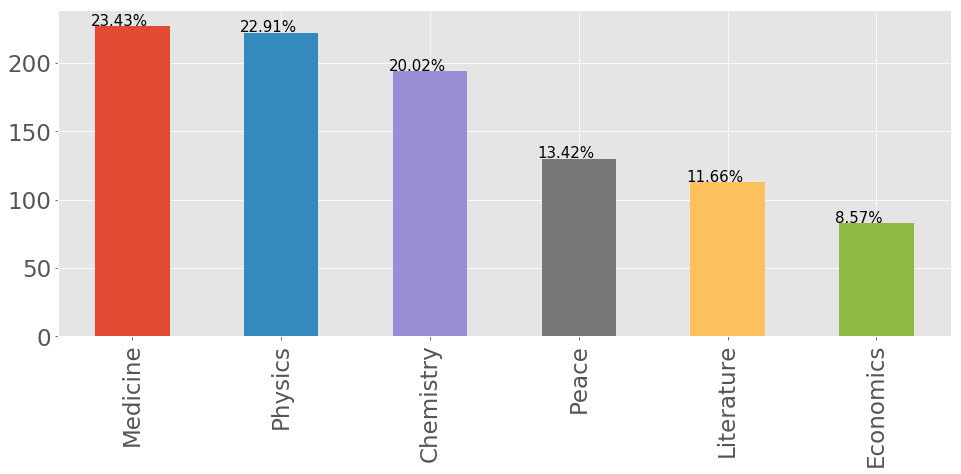
HTML("<h4>lets see the awards in terms of category</h4>")
lets see the awards in terms of category
data_set.Category.value_counts()
Medicine      227
Physics       222
Chemistry     194
Peace         130
Literature    113
Economics      83
Name: Category, dtype: int64
HTML("<h4>lets visualize the awards in terms of category</h4>")
lets visualize the awards in terms of category
cat = data_set.Category.value_counts()
ax = cat.plot(kind='bar',figsize=(16,6))
adjust_plot(ax)
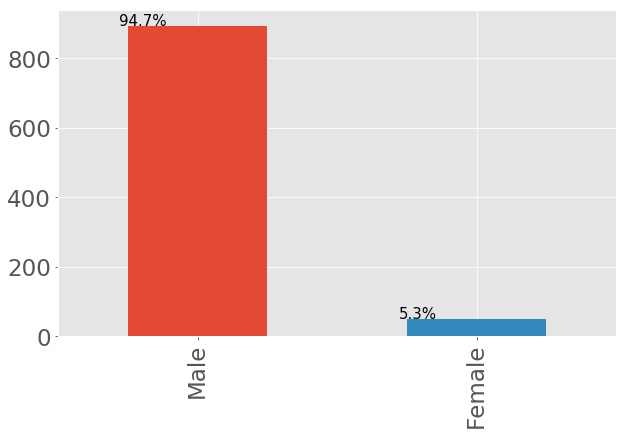
HTML("<h4>lets count the awards in terms of gender</h4>")
lets count the awards in terms of gender
data_set.Sex.value_counts()
Male      893
Female     50
Name: Sex, dtype: int64
HTML("<h4>lets visualize the awards in terms of gender</h4>")
lets visualize the awards in terms of gender
gender = data_set.Sex.value_counts()
ax = gender.plot(kind='bar',figsize=(10,6))
adjust_plot(ax)
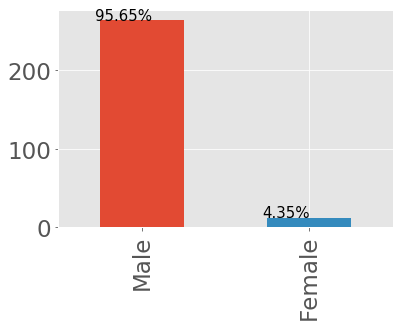
HTML("<h4>lets check the number of female that have won it from united states</h4>")
lets check the number of female that have won it from united states
us = data_set[data_set['Birth Country'] == 'United States of America']
us.Sex.value_counts()
Male      264
Female     12
Name: Sex, dtype: int64
us_v = us.Sex.value_counts()
ax = us_v.plot(kind='bar')
adjust_plot(ax)
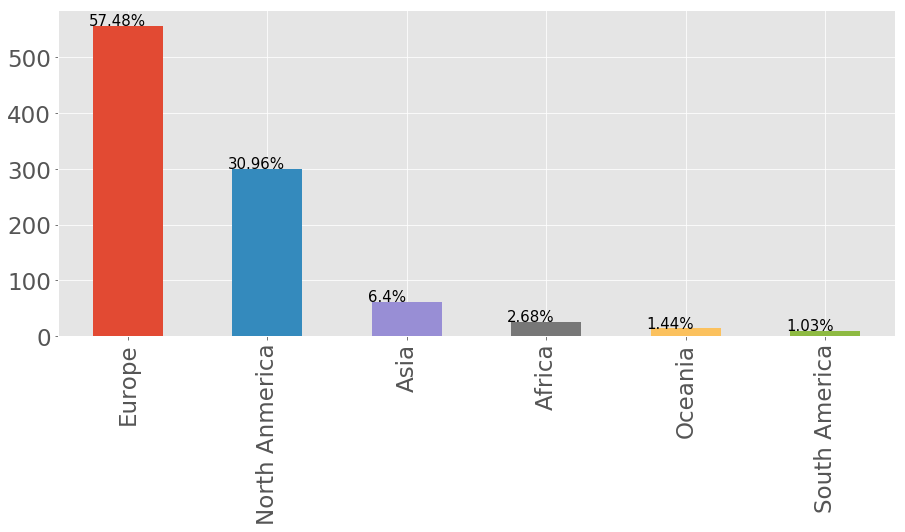
HTML("<h4>lets analyze the awards in terms of continent</h4>")
lets analyze the awards in terms of continent
contries = data_set['Birth Country'].unique()
contries
array(['Netherlands', 'France', 'Prussia (Poland)', 'Switzerland',
       'Prussia (Germany)', 'Schleswig (Germany)', 'India', 'Sweden',
       'Norway', 'Faroe Islands (Denmark)', 'United Kingdom',
       'Russian Empire (Poland)', 'Scotland', 'Spain', 'Russia', nan,
       'Poland', 'Germany', 'Austrian Empire (Czech Republic)',
       'Hungary (Slovakia)', 'Tuscany (Italy)', 'Italy',
       'United States of America', 'Bavaria (Germany)',
       'British India (India)', 'Austrian Empire (Italy)', 'New Zealand',
       'East Friesland (Germany)', 'Russian Empire (Ukraine)', 'Denmark',
       'Luxembourg', 'Russian Empire (Latvia)', 'Belgium',
       'Hesse-Kassel (Germany)', 'Germany (Russia)',
       'Mecklenburg (Germany)', 'Austria', 'Prussia (Russia)',
       'Australia', 'Austria-Hungary (Slovenia)', 'Ireland', 'Canada',
       'Java, Dutch East Indies (Indonesia)', 'Austrian Empire (Austria)',
       'Germany (Poland)', 'Württemberg (Germany)', 'Argentina',
       'Austria-Hungary (Hungary)', 'Austria-Hungary (Austria)',
       'Austria-Hungary (Croatia)', 'Russian Empire (Finland)',
       'Austria-Hungary (Poland)', 'Chile',
       'Austria-Hungary (Czech Republic)', 'Portugal', 'Japan',
       'South Africa', 'Germany (France)', 'Iceland', 'China',
       'French Algeria (Algeria)', 'Guadeloupe Island', 'Brazil',
       'Southern Rhodesia (Zimbabwe)', 'Bosnia (Bosnia and Herzegovina)',
       'Hungary', 'Russian Empire (Azerbaijan)',
       'Ottoman Empire (Turkey)', 'Egypt',
       'Union of Soviet Socialist Republics (Russia)',
       'Austria-Hungary (Ukraine)', 'Guatemala',
       'Russian Empire (Belarus)', 'Vietnam', 'Romania',
       'Austria-Hungary (Bosnia and Herzegovina)',
       'Russian Empire (Russia)', 'Northern Ireland',
       'Poland (Lithuania)', 'British West Indies (Saint Lucia)',
       'Crete (Greece)', 'Ottoman Empire (Republic of Macedonia)',
       'India (Pakistan)', 'Russian Empire (Lithuania)', 'Venezuela',
       'Poland (Ukraine)', 'Bulgaria', 'Lithuania', 'Colombia', 'Mexico',
       'Madagascar', 'German-occupied Poland (Poland)', 'Taiwan',
       'Nigeria', 'West Germany (Germany)', 'Korea (South Korea)',
       'Costa Rica', "Tibet (People's Republic of China)",
       'Burma (Myanmar)', 'Saint Lucia', 'Poland (Belarus)',
       'British Mandate of Palestine (Israel)', 'East Timor',
       'Free City of Danzig (Poland)',
       'Union of Soviet Socialist Republics (Belarus)', 'Trinidad',
       'Gold Coast (Ghana)', 'Iran',
       'British Protectorate of Palestine (Israel)', 'Kenya', 'Turkey',
       'British India (Bangladesh)', 'Persia (Iran)',
       'Czechoslovakia (Czech Republic)', 'Finland', 'Cyprus', 'Peru',
       'Liberia', 'Yemen', 'Morocco', 'Pakistan', 'Ukraine'], dtype=object)
n_america = ['United States of America','Canada','Costa Rica','Guatemala','Mexico',]
europe = ['Netherlands', 'France', 'Prussia (Poland)', 'Switzerland',
       'Prussia (Germany)', 'Schleswig (Germany)','Sweden'
        'Norway', 'Faroe Islands (Denmark)', 'United Kingdom',
       'Russian Empire (Poland)', 'Scotland', 'Spain', 'Russia',
       'Poland', 'Germany', 'Austrian Empire (Czech Republic)',
       'Hungary (Slovakia)', 'Tuscany (Italy)', 'Italy', 'Bavaria (Germany)',
       'Austrian Empire (Italy)',
       'East Friesland (Germany)', 'Russian Empire (Ukraine)', 'Denmark',
       'Luxembourg', 'Russian Empire (Latvia)', 'Belgium',
       'Hesse-Kassel (Germany)', 'Germany (Russia)',
       'Mecklenburg (Germany)', 'Austria', 'Prussia (Russia)',
       'Austria-Hungary (Slovenia)', 'Ireland',
        'Austrian Empire (Austria)','Germany (Poland)', 'Württemberg (Germany)',
       'Austria-Hungary (Hungary)', 'Austria-Hungary (Austria)',
       'Austria-Hungary (Croatia)', 'Russian Empire (Finland)',
       'Austria-Hungary (Poland)', 'Chile',
       'Austria-Hungary (Czech Republic)', 'Portugal',
        'Germany (France)', 'Iceland','Guadeloupe Island','Bosnia (Bosnia and Herzegovina)',
       'Hungary', 'Russian Empire (Azerbaijan)',
       'Ottoman Empire (Turkey)',
       'Union of Soviet Socialist Republics (Russia)',
       'Austria-Hungary (Ukraine)',
       'Russian Empire (Belarus)', 'Romania',
       'Austria-Hungary (Bosnia and Herzegovina)',
       'Russian Empire (Russia)', 'Northern Ireland',
       'Poland (Lithuania)', 'British West Indies (Saint Lucia)',
       'Crete (Greece)', 'Ottoman Empire (Republic of Macedonia)',
        'Russian Empire (Lithuania)',
       'Poland (Ukraine)', 'Bulgaria', 'Lithuania',
       'Madagascar', 'German-occupied Poland (Poland)','West Germany (Germany)',
       'Saint Lucia', 'Poland (Belarus)', 'East Timor',
       'Free City of Danzig (Poland)','Union of Soviet Socialist Republics (Belarus)',
       'British Protectorate of Palestine (Israel)', 'Turkey',
        'Czechoslovakia (Czech Republic)', 'Finland', 'Cyprus',
         'Pakistan', 'Ukraine']
africa = ['Egypt','South Africa','Morocco','Liberia','Southern Rhodesia (Zimbabwe)',
          'Gold Coast (Ghana)', 'Kenya','Nigeria','French Algeria (Algeria)',]
asia = ['Japan','China','India','British Mandate of Palestine (Israel)'
        'British India (Bangladesh)','Korea (South Korea)','Iran','India (Pakistan)',
        'British India (India)','Yemen',"Tibet (People's Republic of China)",
        'Java, Dutch East Indies (Indonesia)','Taiwan','Persia (Iran)','Burma (Myanmar)',
         'Vietnam',]
s_america = ['Trinidad','Venezuela','Brazil', 'Argentina','Peru','Colombia']
oceania = ['New Zealand', 'Australia']
continent = {
    "n_america":n_america,
    "africa":africa,
    "asia":asia,
    "s_america":s_america,
    "europe":europe,
    "oceania":oceania
}
def cont(val):
    if val in continent['n_america']:
        return 'North Anmerica'
    if val in continent['africa']:
        return 'Africa'
    if val in continent['asia']:
        return 'Asia'
    if val in continent['oceania']:
        return 'Oceania'
    if val in continent['s_america']:
        return 'South America'
    return 'Europe' ## this is for europe
data_set['contNumber'] = data_set['Birth Country'].apply(cont)
cotin = data_set.contNumber.value_counts()
ax = cotin.plot(kind='bar',figsize=(15,6))
adjust_plot(ax)

Mustapha Omotosho
constant learner,machine learning enthusiast,huge Barcelona fan